
In my experience within the web development industry, Google Analytics is the go-to solution for monitoring the effectiveness of a website, and for optimising the content. Being able to audit and track not only the sources of your traffic but also the way your users interact with your website, is invaluable information for those willing to use it.
My intention is for this to be the first part of a series of blog posts, all focused on using Google Analytics to revolutionise my content. This introductory post will showcase how I’ve set everything up, what the analytics look like currently as a starting point, and what my goals are in utilising the platform.
Setting up Google Analytics for GDPR
What is GDPR?
As I’m based in the United Kingdom, my biggest concern with digital compliance is GDPR. For those who aren’t aware, the UK’s GDPR laws describe a specific set of guidelines for how you must store and handle data relating to users of your service. In this instance, the service is my website. While there’s minimal information being captured from visitors to my website, I have a responsibility as the administrator of the website to ensure that data is captured and stored securely and that users can specifically consent or opt out of data capturing at any time.
Google Tag Manager Consent Mode
Thankfully, GDPR laws don’t have to leave you with a complicated analytics setup. Google have a service called ‘Google Tag Manager’ (or GTM, for short). GTM is a whole behemoth topic on its own, so I won’t go into too much detail on it today, but here’s a quick introduction: GTM can be added to any website you own with a little snippet of code in the header. Once in place, you can then use GTM’s dashboard to add or remove other code snippets (or ‘tags’), such as cookies, analytics, or almost anything you can think of. The great thing about GTM currently is that, as of writing this post, GTM’s ‘Consent Mode v2’ feature is available for public use. Consent Mode v2 allows you to specifically track what a user’s preferences are for different categories of consent. If used correctly, users can opt in or opt out of several types of cookies, such as tracking, performance, targeting, and more. Using a user’s preferences, you can then control what tags ‘fire’ within GTM. This means that, for example, if a user doesn’t want to allow performance cookies (under which Google Analytics falls), they can reject them, and GTM will send the code across in a different way to accommodate their preferences.
To summarise the above, I have GTM inserted into the header of my website and, via GTM, I’m loading Google Analytics. The last piece of the puzzle then is how I allow users to opt in for cookies. The answer: A cookie banner.
The Cookie Banner for Google Consent Mode
In the <head> section of my website, I’ve inserted GTM. Immediately after, to utilise Consent Mode, I’ve added the default settings to be denied for all of the categories in use. This ensures that users have to opt in:
<!-- Google Tag Manager -->
    ...
<!-- End Google Tag Manager -->
<script>
window.dataLayer = window.dataLayer || [];
function gtag(){
	dataLayer.push(arguments);
}
gtag('consent', 'default', {
	'ad_storage': 'denied',
	'ad_user_data': 'denied',
	'ad_personalization': 'denied',
	'analytics_storage': 'denied'
});
</script>
With this in place, I next added a free cookie banner, sourced from cookieconsent.com. Using their ‘Build your Cookie Consent’ service, I put a free banner together and added the code it provided at the top of my website’s <body> tag. All I had to do then was, following the example on CookieConsent’s website, have the preferences set within the banner and update the preferences for consent in GTM:
<!-- Cookie Consent by TermsFeed https://www.TermsFeed.com -->
<script type="text/javascript" src="https://www.termsfeed.com/public/cookie-consent/4.1.0/cookie-consent.js" charset="UTF-8"></script>
<script type="text/javascript" charset="UTF-8">
document.addEventListener('DOMContentLoaded', function () {
	cookieconsent.run({
		"notice_banner_type":"simple",
		"consent_type":"express",
		"palette":"dark",
		"language":"en_gb",
		"page_load_consent_levels":[
			"strictly-necessary"
		],
		"notice_banner_reject_button_hide":false,
		"preferences_center_close_button_hide":false,
		"page_refresh_confirmation_buttons":false,
		"website_privacy_policy_url":"https://jackwhitworth.com/privacy-policy",
		"callbacks": {
			"scripts_specific_loaded": (level) => {
				switch(level) {
					case 'targeting':
						gtag('consent', 'update', {
							'ad_storage': 'granted',
							'ad_user_data': 'granted',
							'ad_personalization': 'granted'
						});
						break;
					case 'tracking':
						gtag('consent', 'update', {
							'analytics_storage': 'granted'
						});
						break;
				}
			}
		},
		"callbacks_force": true
	});
});
</script>
<noscript>Free cookie consent management tool by <a href="https://www.termsfeed.com/">TermsFeed</a></noscript>
<!-- End Cookie Consent by TermsFeed https://www.TermsFeed.com -->
The callback function invoked on line 18 uses a switch statement and, based on the provided value, it updates the appropriate consent option. For more information on this approach, see CookieConsent’s article.
At this stage, we now have GTM enabled, Google Analytics loaded in via GTM, and consent preferences fed into GTM via consent mode. I ran some tests to ensure everything was working, and everything looked to be working correctly.
My Google Analytics Starting Point
I will say this now: Google Analytics is largely new to me. I’m highly experienced in GTM and integrating Analytics into a site, but I’ve never taken the time to try and utilise Google Analytics fully on my projects before. Because of that, I’m not an expert on how the filters work, what I’m best to look for, or even how to decide on what action to take based on the data. This is all the information which I’m going to learn about over the next few months and is the whole purpose of recording this exercise.
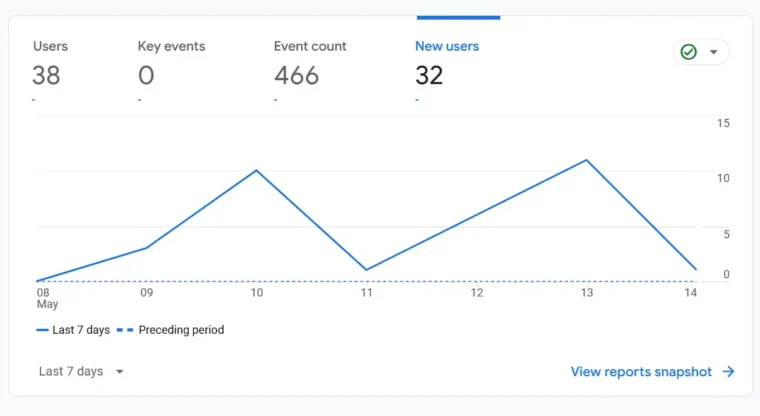
Without further ado, after 6 days of collecting data, it’s looking like this:

Ignoring the 8th of May, as it wasn’t installed at that time, and also the 9th of May where it was only installed for half the day, this leaves us with 5 complete days worth of information. Overall, there are 32 new users over these 5.5 days, with 38 users in total. This means we’re averaging somewhere around 6 new users a day. This isn’t great, but it’s not bad either if you consider the big picture. Most websites struggle to get any traffic because of a range of factors. While I follow best practices for speed, on-page SEO, and content, I don’t do any social media or attempt to drive traffic in any way. Having a steady, if small, stream of visitors coming to the site regularly shows that things are in a great starting point for me to be able to focus on the content itself, instead of fixing basic SEO issues.
My top-5 performing pages this week
Here are the current, top-5 performing pages on my website, according to Google Analytics:
| Page | Views | Users | Average Engagement Time | Event Count |
|---|---|---|---|---|
| Home | 48 | 7 | 38s | 134 |
| A Guide to Using Cloudflare R2 with WordPress | 20 | 17 | 1m 25s | 103 |
| Foreign Keys in Laravel with Eloquent ORM | 5 | 5 | 51s | 23 |
| Python & Pygame Solar System Simulation | 4 | 3 | 1m 26s | 18 |
| Return values from a Python thread | 4 | 3 | 1m 16s | 17 |
When I reviewed this data, I immediately noted that the homepage had the most views. I ran a report that breaks down more granular information on what events happen per page, and this suggests that the homepage is not effective as a landing page, as it’s not encouraging users to explore the rest of the site. Of the 134 events, 0 click events have been recorded.
I next noticed that, while I have 3 blog posts above the 1-minute threshold for engagement time, the ‘A Guide to Using Cloudflare R2 with WordPress’ post had significantly more events than the other 2. In reviewing the granular event data once more, It shows that 5/17 of the users who have visited that page triggered a click event. The article in question has multiple outgoing links, so I can’t say for certain where the users went from this page, as to whether it was internal or external, but I can say for certain that the engagement from that post is much stronger than any of my other content.
Finally, the other thing that stood out to me is that, compared to the other blog posts in that list, the ‘Foreign Keys in Laravel with Eloquent ORM’ post has a low average engagement time. In reviewing the events, I’m unsure as to what I can interpret from the data to help me identify why this is.
My Plans To Utilise The Google Analytics Data
Now that I’ve got a small snapshot as to what’s going on, I want to use the data to attack my weak areas. Based on the table in the previous section, I’ve made myself a small list of actions as a starting point:
- Review the homepage from a user journey perspective.
- This will focus on more effectively encouraging visitors to explore the website.
- I will record what date the changes are made and will review the effects after a week of carrying the changes out.
- I will measure success based on increasing the click-through rate and having sessions showing the home page as the referrer.
- Compare the 3 posts with the higher engagement time, and identify differences in the content between the one that’s got stronger engagement, and the two which do not.
- This will allow me to see if I’ve done something on the stronger post which I haven’t on the weaker ones.
- If I identify any differences, such as more call-to-actions, or better overall content, I will update the weaker posts where possible to try to strengthen their engagement.
- I will measure success based on increasing the engagement on the weaker posts.
- Compare the post with low engagement time against the other 3 to identify what the reasons might be.
- Similarly to point 2, I will see if there’s something I’ve done differently on this point that might explain the poor engagement time.
- If I identify any weak areas, I’ll try to rectify them appropriately.
- I’ll measure success based on increasing the engagement time of this post.
As I noted previously, I’m not an expert on Google Analytics. Aside from the above, I will also be learning about the Analytics platform as much as possible. I would like to learn how to follow a user’s journey more effectively. I’d like to be able to follow a user from the moment they load a page, until the moment they leave. Ideally, this will include events such as scrolling, clicks, and general engagement.
Conclusion
Now that everything’s in place, I’m excited to see what I can do to turbo-charge my website’s performance. While the ultimate goal will be to drive more users to the site, I believe that the best first step is to improve the experience of those who are already finding their way here. By improving my conversion rates with the few that I have now, and by improving the quality of the content and experience in using my website, I believe I’ll naturally see an increase in traffic through referrals and higher search engine placement.
If anyone reading this has any advice for me with regards to Google Analytics, or anything mentioned above, please leave a comment or send me a message via my contact form. Any support or advice is always welcomed and appreciated. Thanks for reading and, keep an eye out for part 2!
Leave a Reply